


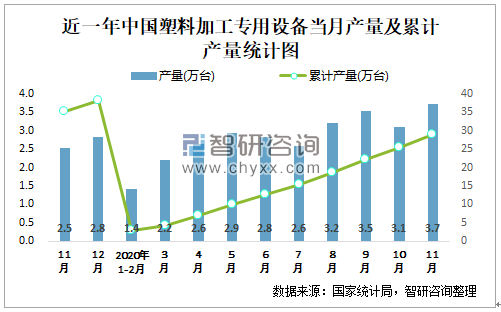
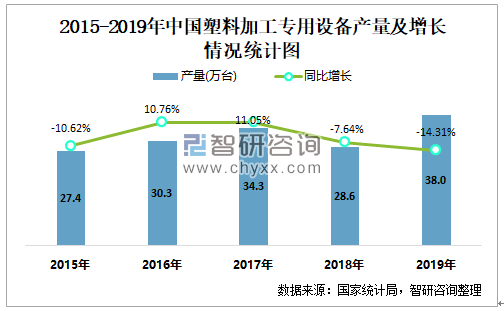
根据国家统计局数据显示:2020年11月中国塑料加工专用设备产量为3.7万台,同比增长42.68%;2020年1-11月中国塑料加工专用设备累计产量为29.1万台,同比下降22.67%;2015-2019年中国塑料加工专用设备产量2019年达到最高,总体呈现上升趋势。
近一年中国塑料加工专用设备当月产量及累计产量统计图
2015-2019年中国塑料加工专用设备产量及增长情况统计图
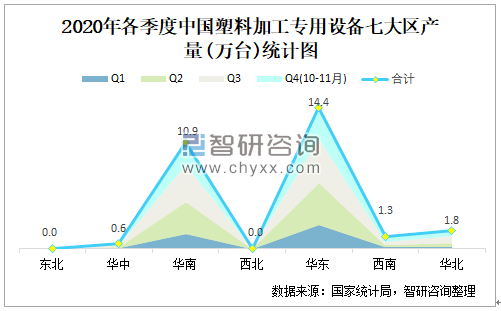
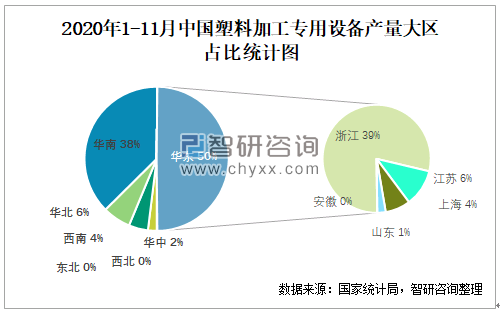
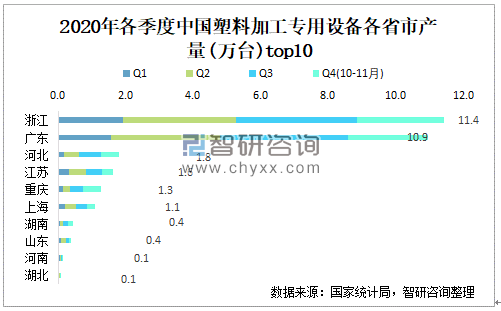
根据国家统计局数据显示:2020年各季度(第4季度暂只统计10月和11月数据)中国塑料加工专用设备主要集中在华东、华南、华北地区生产;2020年1-11月中国塑料加工专用设备产量大区分布不均衡,其中华东地区产量最高,特别是浙江省贡献了最多产量;2020年1-11月中国塑料加工专用设备各省产量呈现梯队式分布,浙江、广东、河北等省产量最多。
2020年各季度中国塑料加工专用设备七大区产量统计图
2020年1-11月中国塑料加工专用设备产量大区占比统计图
2020年各季度中国塑料加工专用设备各省市产量top10
 智研咨询 - 精品报告

2025-2031年中国石油钻采专用设备行业市场全景调研及投资战略研判报告
《2025-2031年中国石油钻采专用设备行业市场全景调研及投资战略研判报告》共十章,包含2020-2024年中国石油钻采专用设备行业上下游主要行业发展现状分析,2025-2031年中国石油钻采专用设备行业发展预测分析,石油钻采专用设备行业投资前景研究及销售战略分析等内容。
如您有其他要求,请联系:


 公众号
公众号
 小程序
小程序
 微信咨询
微信咨询