


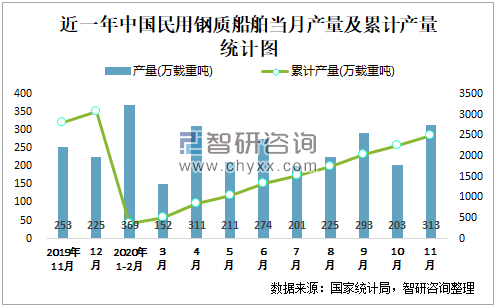
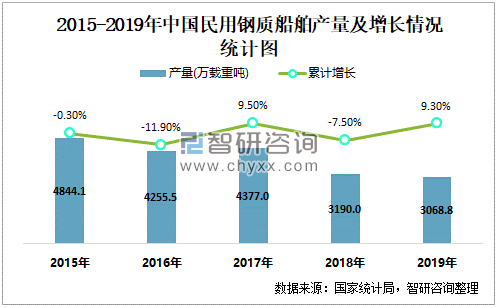
根据国家统计局数据显示:2020年11月中国民用钢质船舶产量为313万载重吨,同比增长24.2%;2020年1-11月中国民用钢质船舶累计产量为2498.5万载重吨,累计下降10.3%;2015-2019年中国民用钢质船舶产量2015年达到最高,此后呈现下降趋势。
近一年中国民用钢质船舶当月产量及累计产量统计图
2015-2019年中国民用钢质船舶产量及增长情况统计图
根据国家统计局数据显示:2020年各季度(第4季度暂只统计10月和11月的数据)中国民用钢质船舶主要集中在华东、华南、东北地区生产;2020年1-11月中国民用钢质船舶产量大区分布不均衡,其中华东地区产量最高,特别是江苏省贡献了最多产量;2020年1-11月中国民用钢质船舶各省市产量top1遥遥领先于其他前9名,江苏、浙江、辽宁等省产量最多。
2020年各季度中国民用钢质船舶七大区产量统计图

2020年1-11月中国民用钢质船舶产量大区占比统计图

2020年各季度中国民用钢质船舶各省市产量top10

 智研咨询 - 精品报告

2025-2031年中国民用钢质船舶行业市场现状分析及产业需求研判报告
《2025-2031年中国民用钢质船舶行业市场现状分析及产业需求研判报告》共十章,包含2020-2024年中国民用钢质船舶相关行业运行形势分析,2025-2031年中国民用钢质船舶行业发展趋势与前景展望分析,2025-2031年中国民用钢质船舶行业投资战略研究等内容。
如您有其他要求,请联系:
版权提示:智研咨询倡导尊重与保护知识产权,对有明确来源的内容注明出处。如发现本站文章存在版权、稿酬或其它问题,烦请联系我们,我们将及时与您沟通处理。联系方式:gaojian@chyxx.com、010-60343812。