

根据中国海关数据显示:2019年1-12月中国其他已搪瓷钢铁制烧锅进口数量为365.75吨,进口金额为469.76万美元;2019年1-12月其他已搪瓷钢铁制烧锅出口数量为34505.48吨,出口金额为10414.32万美元。
2019年1-12月中国其他已搪瓷钢铁制烧锅进出口数量、金额统计表
时间 | 进口数量(吨) | 进口金额(万美元) | 出口数量(吨) | 出口金额(万美元) |
1月 | 18.85 | 39.27 | 3657.68 | 1076.01 |
2月 | 8.64 | 18.89 | 1119.55 | 359.41 |
3月 | 36.49 | 48.26 | 2636.98 | 711.90 |
4月 | 33.99 | 65.94 | 3547.95 | 1052.13 |
5月 | 53.79 | 72.96 | 2971.31 | 872.35 |
6月 | 41.71 | 33.82 | 2474.02 | 748.90 |
7月 | 36.11 | 25.96 | 2985.89 | 878.44 |
8月 | 34.69 | 25.02 | 2793.87 | 884.34 |
9月 | 25.64 | 45.01 | 2976.37 | 900.04 |
10月 | 21.37 | 26.13 | 3047.06 | 889.83 |
11月 | 29.40 | 34.49 | 2627.08 | 844.86 |
12月 | 25.08 | 34.02 | 3667.72 | 1196.11 |
数据来源:中国海关,智研咨询整理
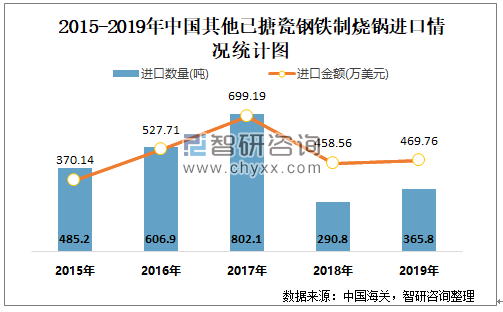
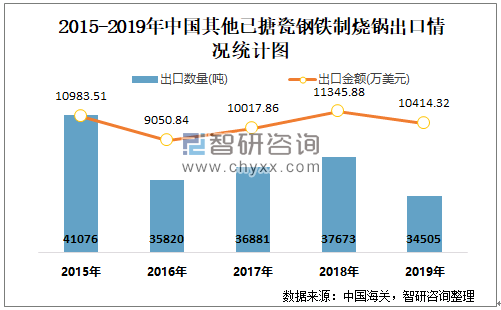
根据中国海关数据显示:2015-2019年中国其他已搪瓷钢铁制烧锅进口数量与进口金额均在2018年达到最高值;2015-2019年中国其他已搪瓷钢铁制烧锅出口数量与出口金额至2018年后呈现下降趋势。
2015-2019年中国其他已搪瓷钢铁制烧锅进口情况统计图
2015-2019年中国其他已搪瓷钢铁制烧锅出口情况统计图
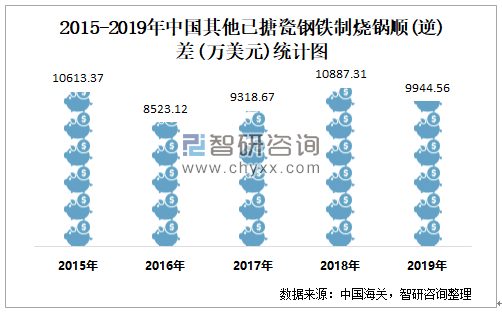
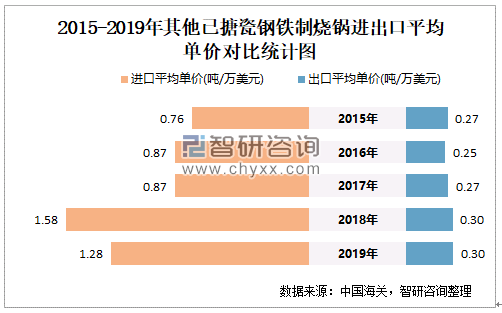
根据中国海关数据统计可知:2015-2019年中国其他已搪瓷钢铁制烧锅出口金额大于进口金额,进出口顺差规模较大;2015-2019年中国其他已搪瓷钢铁制烧锅出口平均单价相对平稳,涨跌幅度较小,进口平均单价均高于出口平均单价。
2015-2019年中国其他已搪瓷钢铁制烧锅顺(逆)差统计图
2015-2019年中国其他已搪瓷钢铁制烧锅进出口平均单价对比统计图
 智研咨询 - 精品报告

2025-2031年中国厨具行业市场竞争现状及投资趋势研判报告
《2025-2031年中国厨具行业市场竞争现状及投资趋势研判报告》共十章,包含厨具行业著名品牌企业分析,2025-2031年厨具行业发展趋势,2025-2031年行业发展策略分析等内容。
如您有其他要求,请联系:


 公众号
公众号
 小程序
小程序
 微信咨询
微信咨询