


根据中国海关数据显示:2019年1-12月中国铜锍;沉积铜(泥铜)进口数量为34222.32吨,进口金额为10233.88万美元;2019年1-12月铜锍;沉积铜(泥铜)出口数量为0.03吨,出口金额为0.04万美元。
2019年1-12月中国铜锍;沉积铜(泥铜)进出口数量、金额统计表
时间 | 进口数量(吨) | 进口金额(万美元) | 出口数量(吨) | 出口金额(万美元) |
1月 | 605.08 | 146.98 | 0.02 | 0.02 |
2月 | 2031.65 | 571.83 | - | - |
3月 | 1089.31 | 303.39 | - | - |
4月 | 3412.96 | 1119.08 | - | - |
5月 | 1280.61 | 438.52 | - | - |
6月 | 2682.53 | 841.49 | - | - |
7月 | 6987.82 | 2307.78 | 0.02 | 0.02 |
8月 | 4858.82 | 1392.75 | - | - |
9月 | 4258.49 | 965.31 | - | - |
10月 | 1612.33 | 480.56 | - | - |
11月 | 1910.09 | 574.12 | - | - |
12月 | 3492.64 | 1092.07 | - | - |
数据来源:中国海关,智研咨询整理
根据中国海关数据显示:2015-2019年中国铜锍;沉积铜(泥铜)进口数量与进口金额2018年跌至最低值,此后呈现上升趋势;2015-2019年中国铜锍;沉积铜(泥铜)出口数量与出口金额均在2017年达到最高值。
2015-2019年中国铜锍;沉积铜(泥铜)进口情况统计图

2015-2019年中国铜锍;沉积铜(泥铜)出口情况统计图

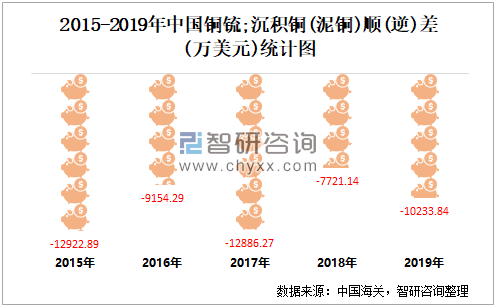
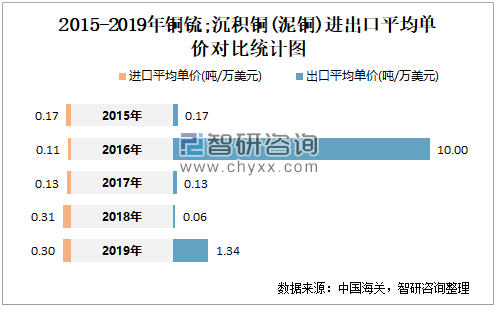
根据中国海关数据统计可知:2015-2019年中国铜锍;沉积铜(泥铜)出口金额小于进口金额,进出口逆差规模较大;2015-2019年中国铜锍;沉积铜(泥铜)出口平均单价波动明显,涨跌幅度较大,2016年和2019年进口平均单价低于出口平均单价。
2015-2019年中国铜锍;沉积铜(泥铜)顺(逆)差统计图
2015-2019年中国铜锍;沉积铜(泥铜)进出口平均单价对比统计图
 智研咨询 - 精品报告
2022-2028年中国铜行业市场竞争态势及发展前景分析报告
《2022-2028年中国铜行业市场竞争态势及发展前景分析报告》共十章,包含2017-2021年中国铜产业主要省市竞争格局分析,中国铜产业重点企业分析,2022-2028年中国铜工业发展及投资分析等内容。
如您有其他要求,请联系:


 公众号
公众号
 小程序
小程序
 微信咨询
微信咨询


![金属铜价格一路飙升,国内主要矿山加足马力开工[图]](http://img.chyxx.com/2021/05/20210526101259.jpg?x-oss-process=style/w320)